
Reasons for customer churn
 Verified & Reviewed


 Copy Link
Churn in ecommerce is rarely one decision and more often an accumulation, and its causes divide into three groups: the product disappointed, a better offer appeared, or the transaction itself went badly. Only the third group is addressable by operations, which is why working out which group dominates comes before spending anything on a fix. This page ranks the causes inside that third group, sets out how to measure each one from records the business already holds, and explains why the largest cause is usually the one nobody wrote in about. The measurement argument sits on churn rate in ecommerce, the early-warning signals on churn risk, and the interventions on reduce churn.
Three groups of cause, three different owners
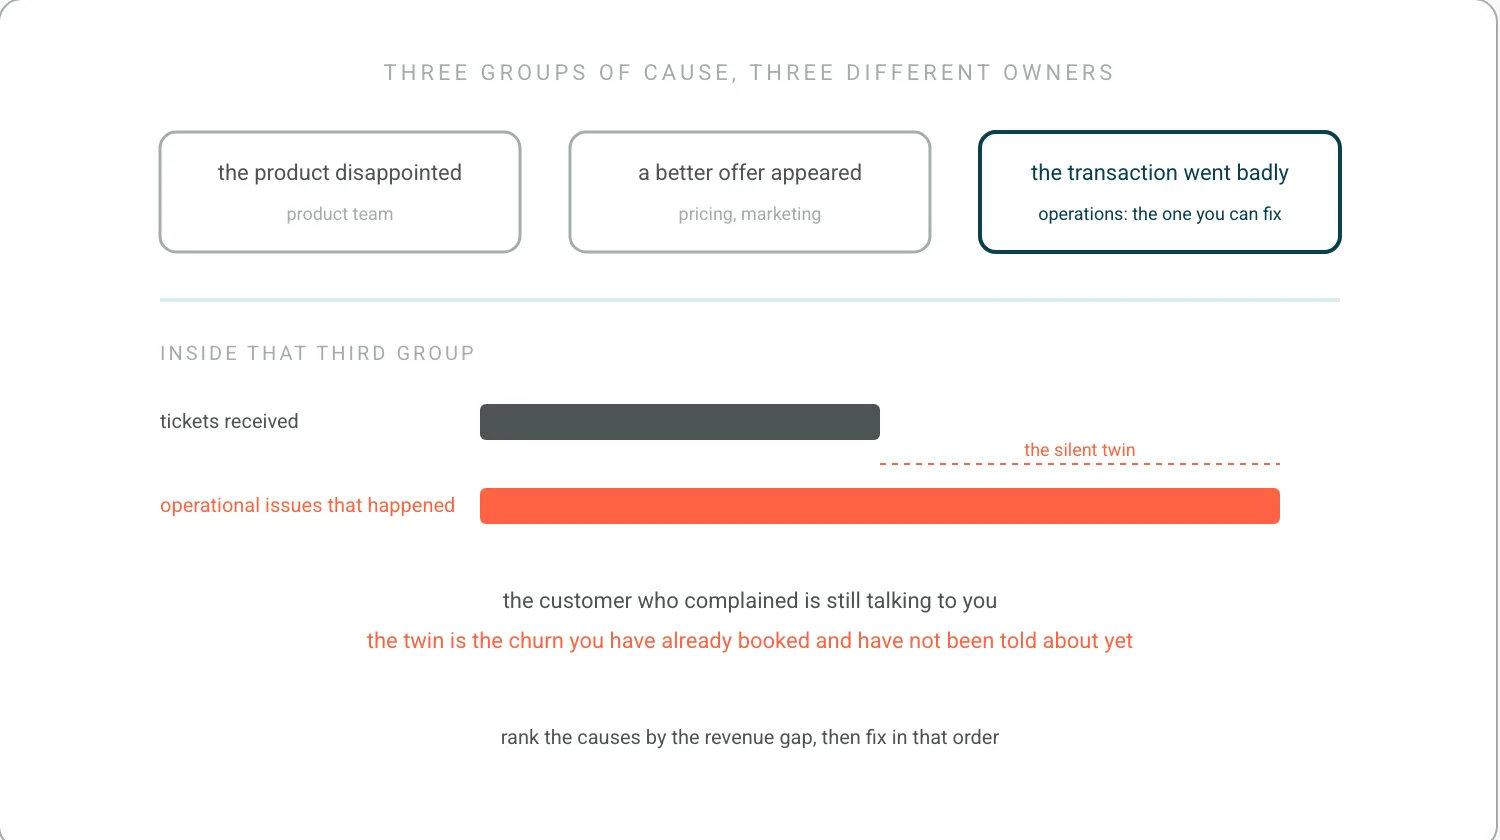
Churn in ecommerce is rarely a single decision and more often an accumulation. The causes divide into three groups. Product causes, where the item disappointed. Price and competitive causes, where a better offer appeared. Experience causes, where the transaction itself went badly. The third group is the one an operations team can address, and it has a consistent composition: late or failed delivery, incomplete or incorrect orders, difficult returns, slow refunds, and support that required chasing. That last one is not a soft factor: the Harvard Business Review research on customer effort found the amount of work a customer is made to do predicts disloyalty better than how delighted they were. Diagnosing which group dominates for a given business is the necessary first step, because the three groups have entirely different remedies and are usually owned by different teams.
There is one root cause that sits underneath most of that list and almost nobody measures it. Operational issues typically run to about twice the number of tickets received. The gap between the problems that actually happened and the problems somebody wrote in about is not noise, and it is not customers being tolerant. It is the churn you have already booked and have not been told about yet. Every ticket in the queue has a silent twin somewhere in the order book, and the twin is the more expensive of the two, because the customer who complained is still talking to you. Which of the two you are looking at is what churn risk is for.
The silent twin is the norm rather than the exception. Across the 786 pain points we mined from 270 customer call transcripts between May 2025 and May 2026, the most repeated theme was CX teams running fully reactive, discovering a system problem only when a customer raised a ticket, and every brand described the period after the warehouse as a black hole. The complaints a business receives are the sample of its failures that customers chose to report.
Treat published churn statistics as illustration, not evidence
Published churn statistics in this area should be treated carefully. Figures asserting a specific proportion of customers who abandon a brand after a single poor delivery are widely circulated, frequently uncited, and vary by category and by how the survey framed the question. Where a public series does publish its method, such as the FTC's Consumer Sentinel Network Data Book on what consumers actually complain about, it measures reported complaints rather than quiet departures, which is a different population from the one churn work cares about. The defensible use of them is illustrative rather than evidentiary. A business's own equivalent figure is straightforward to calculate: take customers whose order experienced a defined failure, measure their subsequent repurchase rate, and compare against a matched group. That number is both more accurate and more persuasive internally than any published one.
I would treat almost every churn statistic in this category with suspicion, including the ones that get quoted back to me. They circulate without a study attached, the denominators move between retellings, and a number that cannot be checked is worth less than one you produced yourself in an afternoon. The replacement is a flagged-order comparison built from your own records, and churn rate in ecommerce sets out that calculation. What this page adds is the diagnostic step nobody runs afterwards: the same comparison, split by failure type, tells you which cause to fix first rather than only what the total is costing.
Support data is the most underused diagnostic
Support data is the most underused churn diagnostic because it records the customers who told the business something was wrong. Three correlations are worth computing. Repurchase rate for customers who contacted against those who did not. Repurchase rate by contact reason. Repurchase rate by whether the contact was resolved at first touch. Contact reason is the diagnostic layer, since it distinguishes a business losing customers to delivery failures from one losing them to returns friction. Customers who experienced a problem and did not contact are a separate and larger group, and their behavior is usually worse.
The gap is created at checkout, not in the warehouse
A significant share of experience churn is not caused by poor performance but by performance that did not match what was promised. A five-day delivery is satisfactory when five days were stated and a failure when two were. This makes the delivery promise itself a churn variable: aggressive delivery commitments raise conversion and raise churn risk simultaneously. In the US the promise is also a legal position rather than only a marketing one, since the FTC's Mail, Internet, or Telephone Order Merchandise Rule treats the shipment date a seller states as the commitment it has to meet or renegotiate. The same applies to return windows, refund timing, and stock availability. Auditing the gap means comparing what the site commits to at the point of purchase against what the operation delivers, per promise type.
The gap in the section title is the whole subject of this page, and it is created at checkout rather than in the warehouse. Every order is a promise, and the promise is the expectation. If customers do not get what they wanted on time, they leave, and every dollar of acquisition spend that won them is written off with them. That is why this reads as an operations problem and gets budgeted as a marketing one: the cost lands in the acquisition line, months later, attributed to a channel. I unpacked that on This Week In Startups Australia, and the money side of it is on what customer lifetime value is.
The transferable part is the detection, not the message
The observable pattern among businesses with strong retention is that they close the loop between operational failure and remedy quickly, communicate before the customer notices, and treat the recovery as an operational trigger rather than a service gesture. What is rarely visible from outside is the monitoring that makes it possible, which is why playbooks copied at the level of tactics, such as adding a delay email, produce weaker results than expected. The transferable part is the detection, not the message, which is the distinction proactive versus reactive customer service is built on.
Fix the failure types directly, and the fixes compound
Logistics-specific retention work targets the failure types directly: improving promise accuracy at checkout, monitoring orders against their promise, detecting stalled shipments early enough to act, resolving lost parcels without the customer chasing, and shortening refund cycles. These are measurable individually and cumulatively, and they compound, because each failure removed stops generating churned customers permanently rather than requiring a repeated campaign. The intervention set that sits on top of them is reduce churn, and the operating context for all of it is post-purchase operations.
Frequently Asked Questions
What are churn triggers?
In ecommerce the operational ones are consistent: a late or failed delivery, an incomplete or incorrect order, a difficult return, a slow refund, and support that required chasing. Those are the group an operations team can address. Product and price causes are real and are usually owned by different teams, which is why diagnosing which group dominates comes before fixing anything.
How do you reduce customer churn?
Rank the causes by what they cost, trace each to the operational event behind it, and fix the event. The intervention set in full is on reduce churn. What this page adds is the diagnostic step in front of it, because a retention program aimed at the wrong cause improves nothing and is hard to argue with afterwards.
What are the key factors in customer retention?
After product satisfaction, the factors an operator controls are promise accuracy at checkout, dispatch performance against that promise, whether an exception is detected before the customer notices, and how much work the customer is made to do when something goes wrong. The last one is the strongest predictor and the least often measured.
References
- Harvard Business Review. Harvard Business Review research on customer effort. Chasing as a churn cause rather than a soft factor.
- US Federal Trade Commission. FTC's Consumer Sentinel Network Data Book. What a published complaint series does and does not measure.
- US Federal Trade Commission. FTC's Mail, Internet, or Telephone Order Merchandise Rule. The stated ship date as a commitment, not a marketing line.
Ready to Stop Reacting?
The fastest way to see how Keeyu prevents complaints is to see it in action.
In one call, we’ll map your current operations, show how our AI Agent fits in, and walk through real examples of issues fixed before customers notice.
Most teams go live within 48 hours. We never share your data.

