
Churn rate in ecommerce
 Verified & Reviewed


 Copy Link
Churn rate is the share of customers who stop buying within a defined period. In a subscription business it is observable, because a cancellation is an event with a date. In a transactional ecommerce business there is no cancellation event, so churn has to be inferred from the absence of a repurchase within a window, and the window is a choice rather than a fact. The usual method is to set the window from the category's normal repurchase interval, then measure the share of a cohort that has not returned by the end of it. Two businesses reporting different churn rates are often reporting different windows. Where a business wants the inference done properly rather than by a fixed cutoff, the probability models for customer-base analysis published at Wharton estimate the likelihood a given customer is still active instead of declaring them gone on a date.
A benchmark is only comparable when the window and the cohort match
A benchmark is only comparable when the window, the cohort definition, and the category all match, which is rarely true of published figures. The exceptions are the series that publish their method alongside the number, such as the US Census Bureau's quarterly retail ecommerce release, and even that measures the market rather than a cohort. Repurchase behavior differs enough between consumables, apparel, and considered one-off purchases that a single ecommerce churn number describes none of them. The more useful internal baseline is the repeat purchase rate at fixed ages, measured as the share of each acquisition cohort that has ordered again by 30, 60, 90, and 365 days. That measure is comparable to itself over time, which is what a benchmark is actually needed for. The share of customers who never place a second order is the specific figure most operations teams are looking for, and it is the first column of the same table.
Flag the order with the failure, then compare repeat rates
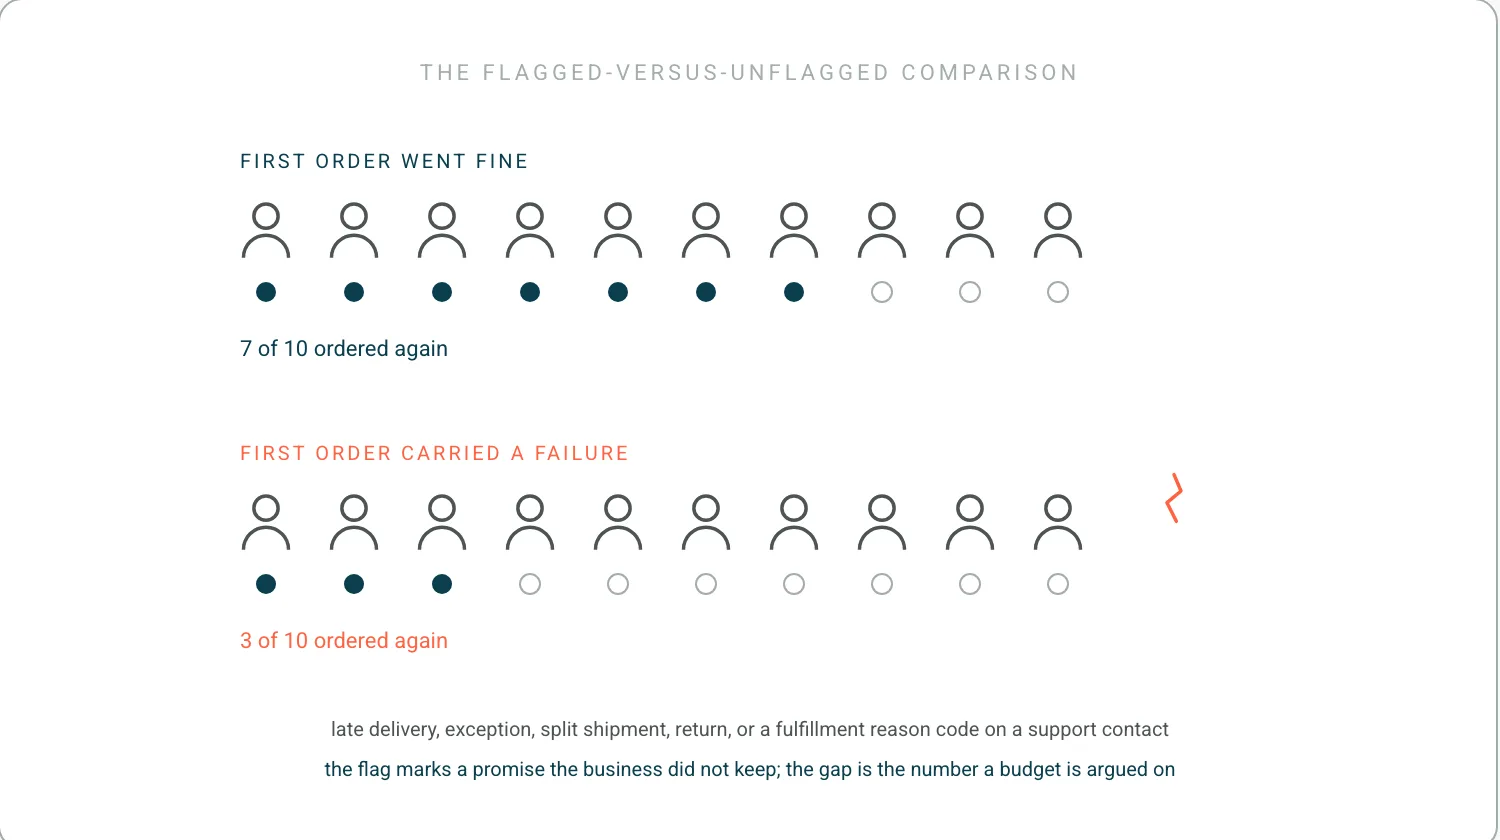
Connecting churn to operational cause requires the order record to carry the failure, not just the outcome. The mechanism is to flag each order with whether it experienced a defined problem, such as a delivery later than the promised date, a delivery exception, a split shipment, a return, or a support contact with a fulfillment reason code, and then compare repeat rates between flagged and unflagged customers in the same cohort. What counts as later than promised is not only a service question in the US: the FTC's Mail, Internet, or Telephone Order Merchandise Rule sets the point at which a delay obliges the seller to offer the customer a choice. That comparison is available to any business with reason codes and order dates. It is correlational, so the honest reading is that flagged customers repeat at a lower rate, not that the failure caused each departure.
The flagged-versus-unflagged comparison is the right method and it is worth being clear about what a flag actually represents. Every order is a promise, and the flag marks a promise the business did not keep. Churn in a transactional business is not a decision customers announce, it is a silence you have to define, and defining it from the last broken promise rather than from a calendar window is what turns the definition into something you can act on. A window tells you somebody stopped buying. A flag tells you when, and why, and whether you could have stopped it. I made the same case on Give it a Nudge, and the diagnostic half of it belongs to reasons for customer churn.
Build the number entirely from your own data
The financial version of that comparison is the difference in repeat rate between flagged and unflagged customers, multiplied by the number of flagged orders in a period, multiplied by the gross profit of an average repeat order. It gives a value for problems prevented rather than for tickets closed, which is the number a tooling budget is argued on. The gross profit figure it multiplies is the same one defined on what customer lifetime value is. Two guards keep it credible. Use gross profit rather than revenue, since a retained customer's next order carries the same cost of goods as any other. And state the window, because a lifetime figure and a twelve-month figure differ by a large multiple and only one of them can be tested against next year's results.
This is the number that gets a budget approved and there is one discipline that keeps it credible. Build it entirely from your own data. Every widely quoted churn statistic in this category is uncited, the denominators shift between retellings, and a figure a CFO cannot trace is a figure they will discount to zero halfway through the meeting. Your own flagged-order comparison has none of those problems, and it has the additional advantage of being about your customers rather than about an average.
Prevention, mitigation, recovery: fund them in that order
The interventions divide by where they sit relative to the failure. Prevention removes the failure, through accurate promise dates, inventory accuracy that stops unfulfillable orders being accepted, and detection of stalled shipments before the customer notices, which is what churn risk covers signal by signal. Mitigation handles the failure well, through proactive notification, a clear resolution path, and a return or replacement that completes without effort from the customer. Recovery acts after the fact, through service gestures and win-back contact, and the full intervention set sits on reduce churn. Their effects are not equal and the order matters: a business that invests only in recovery is paying repeatedly for a failure it could stop generating, and recovery is the most visible of the three, which is why it usually gets funded first. Post-purchase operations is the wider case for funding the first two instead.
Frequently Asked Questions
What is churn in ecommerce?
The share of customers who stop buying within a defined period. In a subscription business it is observable, because a cancellation is an event with a date. In a transactional business there is no cancellation, so churn is inferred from the absence of a repurchase within a window, and the window is a choice rather than a fact.
What is the typical churn rate in ecommerce?
No published figure survives scrutiny here, because a benchmark is only comparable when the window, the cohort definition and the category all match, and few disclose any of the three. The comparison that works is the business against its own cohorts: repeat purchase rate at 30, 60, 90 and 365 days, tracked over time.
What does a 20% churn rate mean?
That one customer in five did not return within whatever window the measure used. The window is the part worth asking about, since the same customer base produces very different rates at 90 days and at 365. A rate quoted without its window and its cohort definition cannot be compared to anything, including a later reading of itself.
References
- Fader and Hardie, Wharton. probability models for customer-base analysis. Inferring churn without a cancellation event.
- US Federal Trade Commission. FTC's Mail, Internet, or Telephone Order Merchandise Rule. When a delay stops being a service issue and becomes an obligation.
Ready to Stop Reacting?
The fastest way to see how Keeyu prevents complaints is to see it in action.
In one call, we’ll map your current operations, show how our AI Agent fits in, and walk through real examples of issues fixed before customers notice.
Most teams go live within 48 hours. We never share your data.

