
Churn risk
 Verified & Reviewed


 Copy Link
Churn risk is the likelihood that a customer stops buying, expressed either as a score per customer or as a segment flagged for intervention. In non-contractual ecommerce there is no cancellation event to observe, so churn is inferred from behavior: a customer is treated as churned once they have not purchased for materially longer than their normal interval. Churn risk is therefore a prediction about silence, and the operational question is which signals precede it reliably enough to act on. The statistical treatment of that inference, estimating whether a customer is still active rather than declaring them gone on a date, is set out in the Wharton probability models for customer-base analysis.
The signals are events, not sentiment
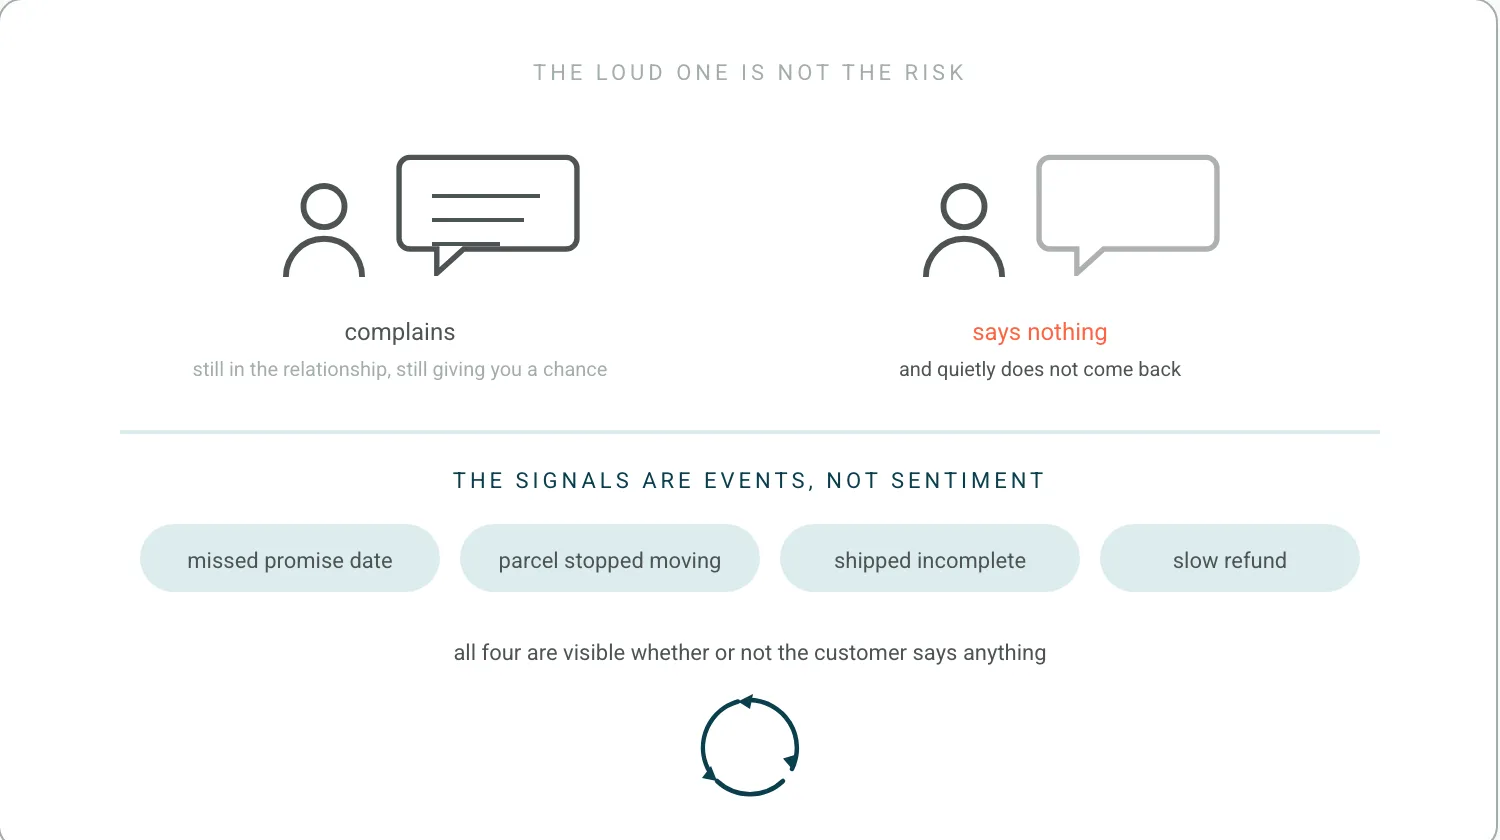
The predictive signals available to an operations team are events rather than sentiment. The strongest are experience failures on a recent order: a delivery that missed its promised date, a shipment that stalled or was lost, an order that shipped incomplete, a return whose refund was slow, and repeated contact about the same order. Lost is a defined state rather than a feeling, and for US domestic parcels it is the point at which a USPS Missing Mail search can be opened, which is a more useful threshold than a customer's patience. Behavioral signals follow: lengthening gap since last order relative to that customer's own cadence, falling order value, subscription payment failures, and a first return following a first order. The signal most teams already hold and least often use is the support record, because a customer who contacted about a problem is measurably less likely to return than one who did not.
The instinct most teams have is to watch the customers making noise, and it is exactly backwards. The loudest customers are not the risk. They care enough to complain, which means they are still in the relationship and still giving you a chance to fix it. The risk is the quiet ones who simply disappear. That is why the signal list above is worth more than a sentiment score: a missed delivery date and a stalled parcel are visible whether or not the customer says anything, and the whole gain comes from moving off waiting for them to reach out and onto spotting disengagement before it happens, which is the argument I made on Add To Cart and the operating model on proactive customer service.
The quiet failures have a shape in our data. When we categorized the 786 pain points we mined from 270 customer call transcripts between May 2025 and May 2026, the largest category was systems failing silently: schedulers and webhooks between the storefront, the ERP and the warehouse system stopping without an error, with the customer ticket as the first signal. Subscription products were a specific case, failing silently when a SKU hit zero and leaving subscribers with no communication at all. For one customer, the change we measured was discovery time, from 'we find out on Tuesday' to 'we find out within the hour'.
Recovery has to follow the fix
Saving flows are automated interventions triggered by a risk signal. In practice they fall into three groups. Service recovery fires immediately after a failed experience, typically a proactive apology carrying a remedy before the customer complains. Reactivation fires as the purchase gap extends, usually a reminder or an incentive. Payment recovery applies to subscriptions, where a failed card is retried and the customer prompted before the subscription lapses. The reactivation group is the one with compliance attached rather than only judgement: US email is governed by the CAN-SPAM rules the FTC publishes, and marketing text messages by the TCPA consent rules at 47 CFR 64.1200, which is why an incentive send and a delivery update are not the same kind of message even when they leave the same system. Timing dominates effectiveness. A recovery offer sent while the customer is still waiting for a resolution reads as an attempt to buy silence, so recovery flows should be gated on the underlying problem being fixed first.
The root cause makes the score unnecessary
This section is the operational root cause behind most of the signals above. Delivery failures and returns friction are the two post-purchase events most strongly associated with non-repeat behavior, and both are addressable without touching acquisition. The delivery loop covers promise accuracy at checkout, dispatch performance against that promise, exception detection while there is still time to intervene, and proactive communication when the promise will be missed. The returns loop covers ease of initiation, transparency while the return is in transit, and refund latency, all of which sit on returns management. Reducing the incidence of these events lowers churn risk at the source rather than managing it at the margin, and the intervention set belongs to reduce churn while the underlying causes belong to reasons for customer churn.
This is the section that makes the rest of the page unnecessary, which is a strange thing to write on a page about risk scoring. Every order is a promise, and a churn risk score is a way of measuring how many promises you have already broken. Detecting the broken promise while the parcel is still moving is a different exercise from scoring the customer afterwards, and it is the one that changes the outcome. Predicting churn accurately and doing nothing upstream leaves you with a very good estimate of a number that keeps happening.
Run the correlation once, then read it per order
Cross-industry churn benchmarks are of limited use because repurchase cadence varies enormously by category, so the reliable comparison is a business against its own cohorts. The analysis worth running is a correlation between experience events and subsequent repurchase: take customers who had a late delivery, a lost parcel, or a slow refund, and compare their next-order rate against a matched group who did not. That single analysis converts operational failures into a churn cost the business can quantify, and it uses data most teams already hold in their order and support systems.
That correlation is the right analysis, and most teams run it once, as a project, and then go back to reporting ticket counts. Read per order instead of per quarter it becomes an operating number: which orders are currently breaking a service level, and what the lifetime value attached to those customers is worth. That converts a retrospective correlation into something a team can act on this morning. Whether the underlying rate is worth benchmarking at all is a separate question, and it belongs to churn rate in ecommerce, which owns the measurement argument for this family.
Frequently Asked Questions
What does churn mean in business?
A customer ending their relationship with a business. In non-contractual ecommerce there is no ending to observe, so churn is inferred from silence: a customer is treated as churned once they have not purchased for materially longer than their own normal interval. Churn risk is therefore a prediction about that silence.
What does a 20% churn rate mean?
That one customer in five did not return inside the measurement window. On a page about risk the more useful reading is which fifth: the same rate means something different when it is concentrated in customers whose orders went wrong than when it is spread evenly, and only the first version tells you which signal to act on.
What is churn versus turnover?
Churn describes customers leaving. Turnover, in most business usage, describes employees leaving. They are measured similarly and they are not the same subject, and this page is about the first. The one place they meet is that a support team permanently sized around preventable failures tends to produce both.
How do I calculate my churn rate?
The rate itself belongs to churn rate in ecommerce, which sets out the window, the cohort and the calculation. Risk is the forward-looking version: rather than measuring who has already gone, score who is likely to, using the experience events above alongside recency and frequency.
References
- Fader and Hardie, Wharton. Wharton probability models for customer-base analysis. Predicting silence rather than declaring it.
- United States Postal Service. USPS Missing Mail search. Lost as a defined state with a threshold.
- US Federal Trade Commission. CAN-SPAM rules the FTC publishes. What a reactivation email is allowed to be.
- US Electronic Code of Federal Regulations. TCPA consent rules at 47 CFR 64.1200. Why a marketing text and a delivery update are different sends.
Ready to Stop Reacting?
The fastest way to see how Keeyu prevents complaints is to see it in action.
In one call, we’ll map your current operations, show how our AI Agent fits in, and walk through real examples of issues fixed before customers notice.
Most teams go live within 48 hours. We never share your data.

