
Ecommerce KPIs
 Verified & Reviewed


 Copy Link
Ecommerce KPIs are the measures a team uses to judge whether the business is performing, and they differ by function. For an operations or post-purchase team the relevant set describes what happens between checkout and a settled customer: whether orders ship on time, how many go wrong, how much contact they generate, how returns behave, and what customers make of the experience. These are distinct from acquisition KPIs such as conversion rate or cost per acquisition, and they are frequently absent from the dashboards executives review. Building a baseline for them from your own orders is ecommerce benchmark.
WISMO rate: the one number that moves when anything upstream breaks
WISMO rate is the share of support contacts asking where an order is, usually expressed as a percentage of total contacts or per hundred orders shipped. It is the single most diagnostic post-purchase measure, because it moves for two different reasons: poor visibility, meaning customers cannot find out, and poor performance, meaning orders are genuinely late. Separating the two requires pairing it with an on-time measure. Both are defined at length on WISMO, which carries the formula this section only names. Tracked per hundred orders rather than as a share of contacts, it also stays stable as volume grows, which makes it usable across seasons.
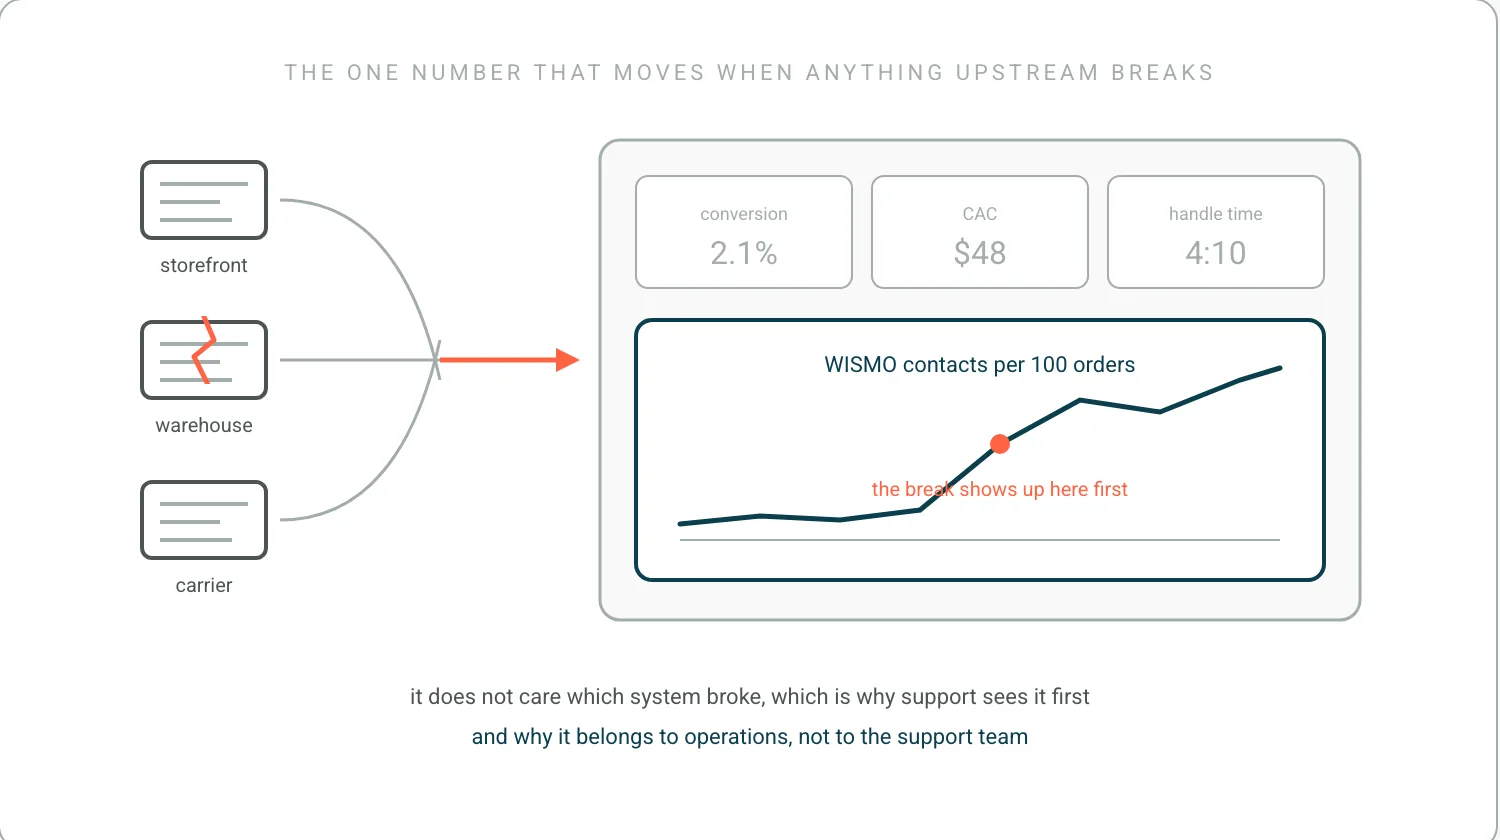
If I could put one number on an operations dashboard it would be this one, because it is the only measure that moves when something upstream breaks and it does not care which system broke. Support sees it first, and support is usually the last function anyone asks. The trap is treating it as a support metric and giving it to the support team to reduce, at which point the honest ways to move it are all upstream and none of them are theirs to pull. That is the argument I made on the Retail Fest post-purchase panel, and the ownership question behind it is post-purchase operations.
The reason it is the number is in our own data. Across the 786 pain points we mined from 270 customer call transcripts between May 2025 and May 2026, WISMO and delivery delays were the largest customer-driven ticket category, and the cost was not the tickets themselves. It was the 15 to 19 hours a month CX teams were spending on manual outreach for orders marked fulfilled that had never arrived. Every brand in that dataset described the period after the warehouse as a black hole, a phrase they reached for unprompted, and every one of them found out about the problem from the customer.
Measure against the promise, not the benchmark
This group covers time from order placed to dispatch, dispatch to delivery, and the composite time from order to doorstep. The operationally meaningful version measures against the promise made at checkout rather than against a generic benchmark, since a two-day dispatch is a failure where same-day was promised and a success where five days were. A carrier measuring itself does the same thing against its own stated standard, which is how USPS publishes service performance. Supporting measures include the share of orders dispatched before cut-off, on-time delivery rate by carrier and lane, and exception rate, meaning the share of shipments that hit a delay, failed attempt, or loss event.
Almost nobody measures against their own promise, and the reason is not stubbornness. Most stacks give you two states for an order, shipped and delivered, and a service level built on two states cannot tell you that a parcel has been sitting still for four days. That is why the measure worth adding is the promise-kept rate: of the orders due to arrive this week, how many actually did, and of the ones that did not, how many did we know about before the customer did. Getting an order into more than two states is an events problem, and the GS1 EPCIS standard is the vocabulary the industry already has for it. Every order is a promise. A dashboard that reports dispatch performance and delivery performance separately is reporting on two halves of a promise and never on the promise itself.
Return reason mix is the actionable number
Return rate is measured by units or by order value, and its interpretation depends on category, so it is compared against a business's own history rather than a cross-industry figure. Three measures underneath it are more actionable. Return reason mix separates fit and expectation problems from operational ones such as a wrong item shipped or damage in transit. Return cycle time runs from request to refund. Refund latency is a common driver of contact in its own right. Exchange or store-credit conversion rate indicates how much returned revenue is retained. The formula for the headline number is on the product return rate formula and the process is returns management.
The group most likely to improve while the business gets worse
The standard measures are contacts per order, first-contact resolution, average handle time, backlog age, and cost per contact, most of which are read against the clock discussed on resolution time. Contacts per order is the most useful for an operations audience because it links support load to order volume and exposes whether growth is compounding cost. Handle time should be read alongside resolution quality, since it falls when agents close tickets without fixing the underlying order. Ticket reason mix is what turns these measures into action, because it identifies which operational failures are generating the load. The measure this page deliberately does not define, the complaint prevention rate, is on complaint resolution process, where it is the argument rather than a list entry.
This is the group most likely to be improving while the business gets worse. Handle time and first-contact resolution both respond to better tooling and better scripts, and neither one notices that the number of arriving contacts is rising. Contacts per order is the one in the list that does, which is why it is the only support measure I would show an executive. The rest describe how well a team is absorbing a problem, and absorbing it well for long enough is how a support function ends up permanently sized around a failure nobody upstream ever had to fix. Orders arriving on time, as promised, is the outcome all of these numbers are supposed to be a proxy for. What absorbing the problem well costs over a year is waiting for complaints costs.
Behavior beats declared sentiment
Sentiment is captured through post-delivery survey scores, review content, and repeat-purchase behavior. Satisfaction scores collected at delivery reflect the whole fulfillment experience rather than the support interaction, which is why survey timing changes what is being measured. Likelihood to recommend, the other declared measure usually reported here, was proposed in Harvard Business Review and has been argued about ever since, which is itself a reason to pair it with behaviour. The most reliable operational signal is behavioral rather than declared: whether a customer who experienced a failure orders again. That measure connects this section back to lifetime value and makes the post-purchase KPI set legible to a finance audience. The behavioural version of it, split on whether the order failed, is churn rate in ecommerce.
Frequently Asked Questions
What are the 5 main KPIs?
For a post-purchase team the working five are WISMO rate, on-time delivery against the promise made at checkout, contacts per order, return rate with its reason mix, and repeat purchase rate. Acquisition measures such as conversion rate and cost per acquisition are a different set for a different function, and they are the ones usually on the dashboard instead.
What are the 5 KPIs in retail?
Retail lists usually cover sales per square foot, conversion, average transaction value, units per transaction and gross margin, all of which describe the sale. The post-purchase set describes what happens after it, which is the half that decides whether the customer comes back, and almost none of it appears in a standard retail scorecard.
What is the 80/20 rule in ecommerce?
That a small share of causes produces most of the effect. In post-purchase it holds unusually well: reason-code analysis normally shows a handful of operational failures generating most of the contact volume, which is why reason mix is the measure that turns a dashboard into a work list.
References
- United States Postal Service. USPS publishes service performance. Measuring against a stated standard rather than a generic benchmark.
- GS1. GS1 EPCIS standard. Getting an order past two states, which the promise-kept measure needs.
- Harvard Business Review. proposed in Harvard Business Review. Where likelihood to recommend comes from, and why it is contested.
Ready to Stop Reacting?
The fastest way to see how Keeyu prevents complaints is to see it in action.
In one call, we’ll map your current operations, show how our AI Agent fits in, and walk through real examples of issues fixed before customers notice.
Most teams go live within 48 hours. We never share your data.

