
Customer lifetime value formula in Excel
 Verified & Reviewed


 Copy Link
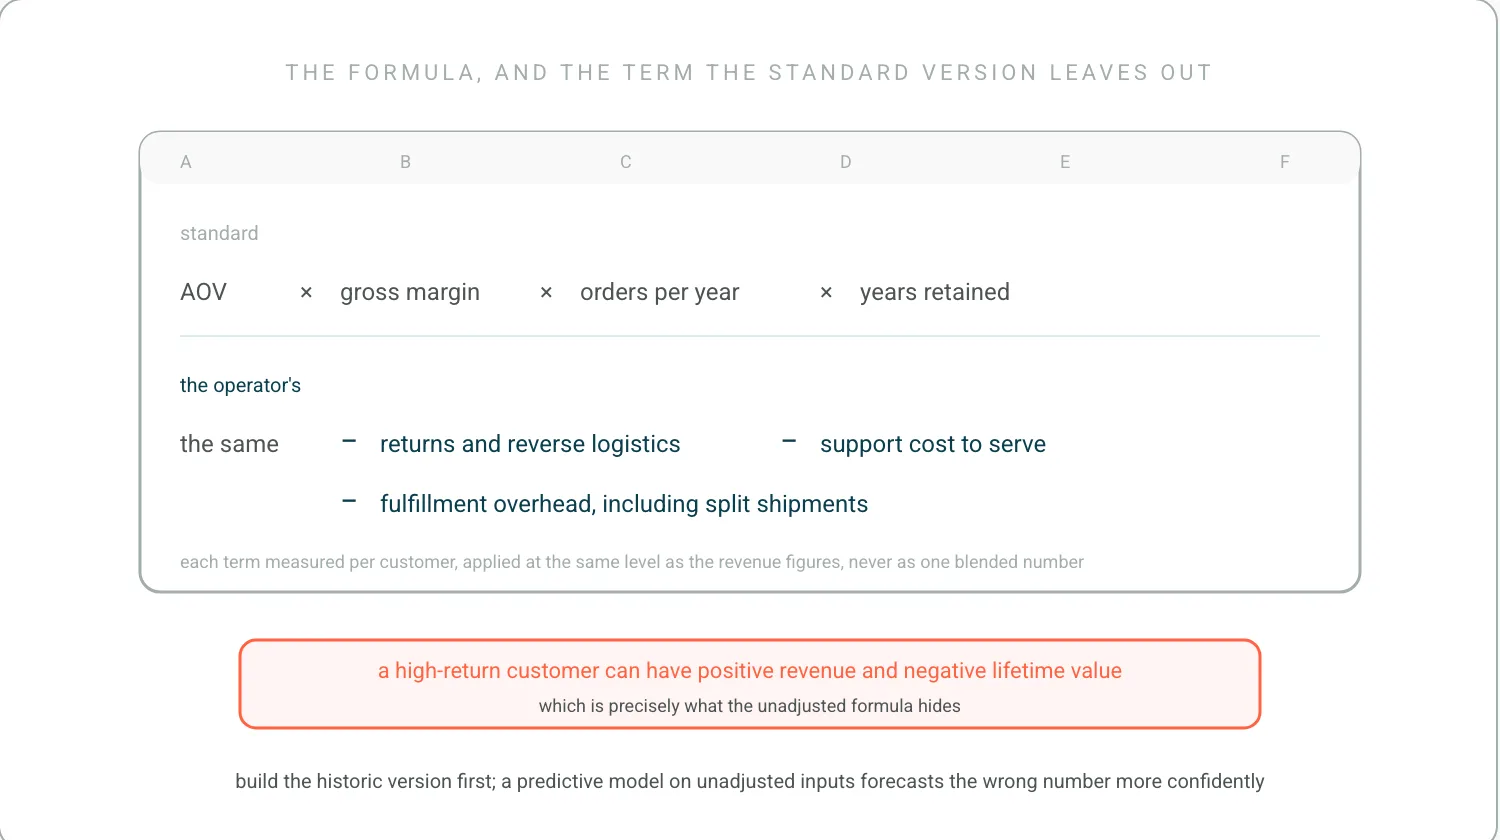
Customer lifetime value is the total gross profit a customer produces across their whole relationship with a business. The standard spreadsheet form is average order value multiplied by gross margin, multiplied by purchase frequency per year, multiplied by expected customer lifespan in years. The formula an operations team needs differs from that one in a single respect: it subtracts the cost of serving the customer, because returns, support contacts, and fulfillment overhead are all incurred per customer and none of them appear in the standard version.
A ready-to-use formula
The historic form, which uses observed data and no forecasting, is the one to build first. In a sheet with one row per customer, lifetime value is the sum of that customer's order values, multiplied by gross margin percentage, minus their attributable service costs. At the segment level the same figure is AOV * gross_margin * orders_per_year * years_retained. Where the order and fulfillment records come out of Shopify, the fields this needs are on the Order resource and the Fulfillment object, which is worth checking before anyone rebuilds them by hand. Expected lifespan can be derived from retention rate as 1 / (1 - retention_rate) where retention is measured over the same period as the purchase frequency, and mixing periods in that division is the most common error in this calculation. That formula assumes a constant retention rate, which real cohorts do not have, and the Wharton probability models exist because of exactly that gap. Build the historic version before any predictive one, since a predictive model built on unadjusted inputs forecasts the wrong number more confidently.
Post-purchase and operational adjustments to CLV
The adjustment is a single subtracted term, and it is built from three components measured per customer or per order and then applied at the same level as the revenue figures. Each is worth calculating separately rather than as one blended cost-to-serve number, because they respond to different fixes and a blended number cannot tell an operations team which fix to make.
Return rates and reverse logistics costs
The cost of a return is the return shipping, the handling and inspection labor, the restocking or disposal outcome, and the lost margin where the item cannot be resold at full price. Applied per customer, it is the return rate for that customer or segment multiplied by the average cost per return, multiplied by their order count. Categories differ enough that a site-wide return rate distorts the result, so segment at least by category before applying it. A high-return customer can have positive revenue and negative lifetime value, which is precisely what the unadjusted formula hides. The product return rate formula page carries the per-customer and per-category rates this term needs.
Customer support cost-to-serve
Support cost per customer is contacts per customer multiplied by the fully loaded cost per contact. Contacts per customer follows a long tail rather than a normal distribution, so the mean overstates the typical customer and understates the expensive one. Reason codes are worth carrying through into this term, because a customer contacting about a genuine fulfillment failure is not the same signal as a customer contacting about product choice, and only one of the two is a cost the business created. Reasons for customer churn covers which of those codes actually predicts the customer leaving.
Shipping and fulfillment overhead
Fulfillment overhead is the pick and pack fee, the packaging, the outbound carrier cost net of what the customer paid, and any surcharges such as residential delivery, remote area, or dimensional weight. This term varies by geography and by basket shape rather than by customer behavior, which makes it the easiest of the three to model and the most likely to be already available from a third-party logistics invoice. Split shipments matter here, since an order fulfilled from two locations pays two outbound costs against one order value.
Cohort-based repeat purchase tracking
A cohort model groups customers by the period of their first order and tracks what share of each group orders again at 30, 60, 90, and 365 days. It answers the question the multiplied formula cannot, which is whether retention is changing over time or only the mix of customers is. In a sheet this is a matrix with acquisition month down the side and elapsed period across the top, holding the repeat rate in each cell. Reading the columns compares cohorts at the same age, which is the only fair comparison, and reading a row shows a single cohort maturing. A change in post-purchase handling shows up as a difference between adjacent cohorts at the same age. Ecommerce benchmark carries a fifty-order audit that produces the split-on-a-flag version of this matrix without waiting a quarter for it, and ecommerce customer lifetime value covers what the resulting curves usually look like in retail.
A way to justify post-purchase tooling
The business case is the difference between the adjusted lifetime value with the intervention and without it, multiplied by the number of customers affected, compared against the cost of the tooling. Two inputs carry the argument and both should be the operator's own. The first is the share of customers who experience a fulfillment problem, which is a rate the business can measure from its own reason codes. The second is the difference in repeat rate between customers who experienced a problem and those who did not, which comes straight out of the cohort matrix if the cohorts are split on that flag. Building the case from those two figures is defensible, because both are observed rather than assumed. A case built on a vendor's published benchmark is not, and the honest exceptions are the few benchmarks that publish their method with the number, such as the US Census Bureau's quarterly retail ecommerce series. Where the model rather than the arithmetic is the question, customer lifetime value model covers the choice.
One framing makes this case land with a finance audience and it is worth stating before the spreadsheet goes in front of anyone. I put it this way on The Growth Concept. Even if only a third of your tickets are post-purchase, what that third protects is lifetime value, and lifetime value is expensive to replace. Every order is a promise, and the adjusted figure on this page is simply what a broken one costs once the operational side is counted. Acquiring that customer took real money the business has already spent, so the adjustment says whether that spend is being protected or quietly written off. That is the argument, and every input to it is a number the business already has. The wider case for reading it that way belongs to what customer lifetime value is, which this page deliberately does not restate.
Frequently Asked Questions
What is customer lifetime value?
The total gross profit a customer produces across their whole relationship with a business. The definition and the four levers that move it are on what customer lifetime value is. This page is the spreadsheet: the historic formula, the cost-to-serve adjustment, and the cohort matrix underneath both.
How do you calculate the LTV formula?
In a sheet with one row per customer, lifetime value is the sum of that customer's order values, multiplied by gross margin, minus their attributable service costs. At segment level it is average order value times gross margin times orders per year times years retained. Expected lifespan can be derived from retention rate as one divided by one minus the retention rate, measured over the same period as the purchase frequency.
What is a good CLV to CAC ratio?
Three to one is the conventional target. The more useful question on a page about the arithmetic is whether both sides of the ratio were calculated the same way, since an acquisition cost that includes agency fees and a lifetime value that ignores returns and support costs are not comparable numbers, and the adjusted version is usually the one that changes a decision.
References
- Fader and Hardie, Wharton. Wharton probability models. The constant-retention assumption inside 1/(1-r).
- Shopify. Order resource. Where the per-order revenue fields live.
- Shopify. Fulfillment object. Where the fulfillment cost fields live.
Ready to Stop Reacting?
The fastest way to see how Keeyu prevents complaints is to see it in action.
In one call, we’ll map your current operations, show how our AI Agent fits in, and walk through real examples of issues fixed before customers notice.
Most teams go live within 48 hours. We never share your data.

